Thanks for great work. Not sure if I just missed something or if there is anything else that has to be done but my dashboard is all empty. The script runs fine and in Grafana I am able to see the vmperf value. Default it looks like below. However if I do change values from $group and $vm to * i do get some values and info but I suppose this is not correct.
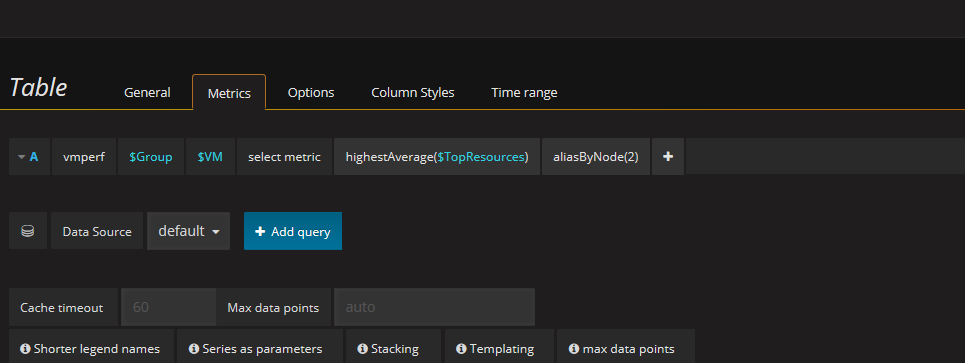
Thanks for great work. Not sure if I just missed something or if there is anything else that has to be done but my dashboard is all empty. The script runs fine and in Grafana I am able to see the vmperf value. Default it looks like below. However if I do change values from $group and $vm to * i do get some values and info but I suppose this is not correct.