
Self-hosted PCAP analysis tool for black-box network traffic forensics — reconstruct devices, topology, sessions, and threats from captured packets alone, with no prior knowledge of the network.
Features • Quick Start • Usage • Documentation


TracePcap is a self-hosted PCAP analysis workbench for black-box network analysis — situations where you work from the traffic itself, with no documentation or prior knowledge of the network. Upload one or more packet captures and TracePcap characterises devices, maps topology, reconstructs sessions, detects threats, tracks changes over time, and generates AI-powered narratives — all derived purely from observed traffic. It runs fully offline / air-gapped and keeps packet data on your own infrastructure.
This makes it well-suited for:
- Network audits and third-party assessments — handed a PCAP with no documentation; build the picture from scratch
- Incident response & network forensics — incomplete records; reconstruct what happened from packet evidence
- Penetration test reconnaissance — map an unknown or scarcely-documented network from captured traffic
- Research and education — explore any capture without needing context about the environment
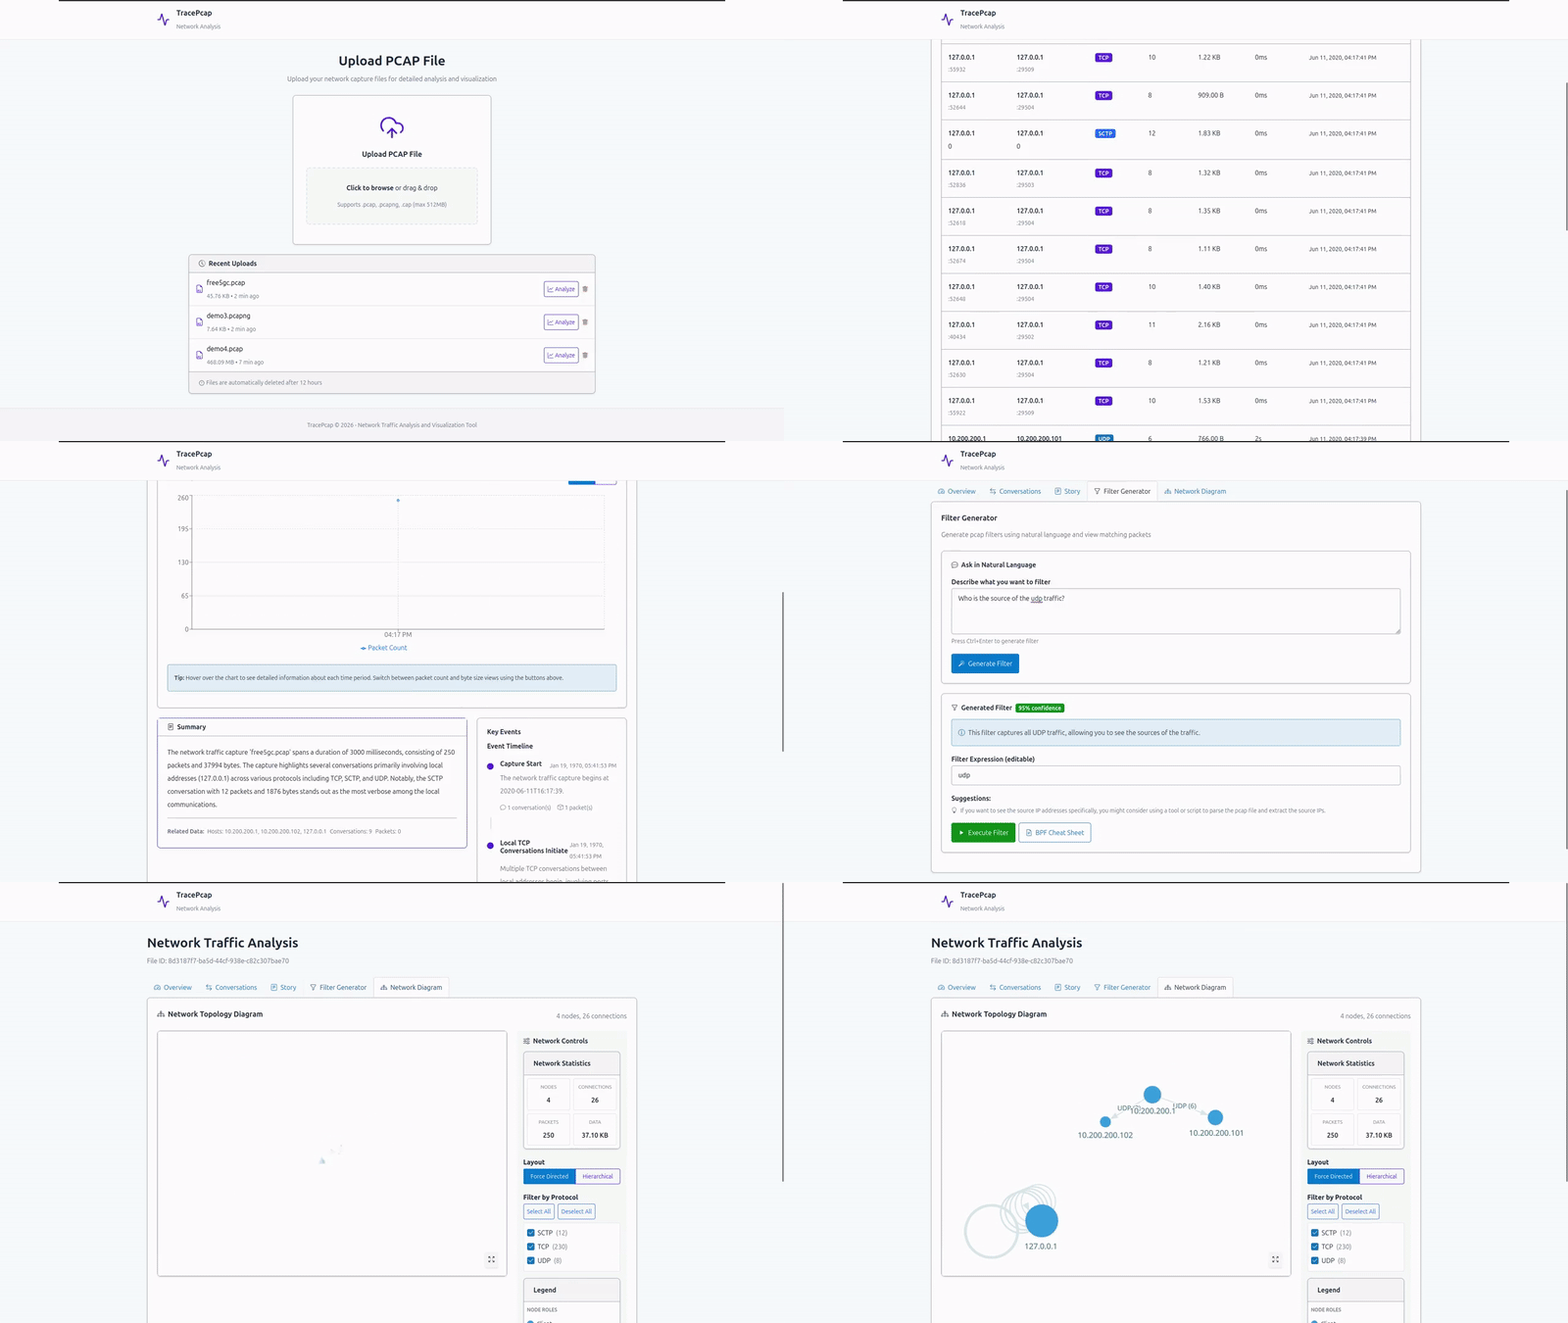
TracePcap's capabilities fall into five pillars. Each links to its full page in the documentation.
| Capability | What it does |
|---|---|
| Network Visualization | Interactive topology using Sigma.js (WebGL) + graphology with ForceAtlas2 / ELK layouts, a rich filter panel (IP, port, device type, protocol, risk), fullscreen toggle, and clickable node detail panels |
| Device Classification | Automatic device-type inference (Router, Server, IoT, Mobile, Laptop/Desktop) from traffic behaviour and manufacturer data |
| Subnet Detection & Labelling | Infer subnet structure from traffic patterns or define CIDRs manually; group observed IPs by subnet across all snapshots |
| MAC Manufacturer Lookup | Wireshark OUI database integration for vendor identification from MAC addresses |
| Node Role Annotation | Annotate any IP/device with a role label (e.g. "SCADA Controller", "Historian"); AI-suggested from traffic signals, human-confirmable |
| Capability | What it does |
|---|---|
| Conversation Tracking | Paginated conversation list with advanced filtering (IP, port, protocol, app, risk, custom rules, device type, country, payload pattern), multi-column sorting, column picker, and bulk PCAP export |
| Session Reconstruction | TCP/UDP application-layer payload decoding with a hex + ASCII viewer for inspecting raw packet payloads |
| File Extraction | HTTP object extraction and raw TCP/UDP stream extraction; automatic MIME type detection; bulk download |
| Timeline Analysis | Chronological traffic visualization with configurable time granularity and protocol breakdown |
| Capability | What it does |
|---|---|
| nDPI Deep Packet Inspection | nDPI v5: application identification, traffic categories, risk/alert flags, JA3/JA3S TLS fingerprints, SNI extraction, and TLS certificate metadata per conversation |
| Custom Signature Rules | YAML detection rules matched against IP, CIDR, port, JA3, hostname, app, protocol, and payload byte / regex patterns; live-reloaded without restart |
| Geolocation & ASN Enrichment | Country/ASN enrichment for external IPs via a bundled offline GeoIP database (optional online enrichment when reachable) |
| Capability | What it does |
|---|---|
| Story Mode | AI-generated narrative reconstruction of network activity with an interactive LLM Q&A chat, custom context input, and story timeline |
| AI Filter Generator | LLM-powered Wireshark/tcpdump filter generation from natural-language queries, with confidence scores and packet-level results |
| Capability | What it does |
|---|---|
| Network Monitor | Load multiple PCAPs as ordered snapshots to track device, IP, protocol, and topology changes over time — useful for repeated audits or ongoing capture sessions |
| Change Detection | Automatic diffing between consecutive snapshots — ARP/MAC drift, gateway changes, new devices, new protocols/apps, ASN and VPN shifts — ranked by severity (details) |
PCAP Upload & Management (PCAP/PCAPNG/CAP with MinIO object storage, duplicate detection, configurable limits) · Real-time asynchronous processing with stage-by-stage progress · Multi-protocol support (TCP, UDP, ICMP, TLS, HTTP, DNS, QUIC, and L2: ARP, STP, LLDP, CDP) · Export as PDF report (with live topology capture), per-conversation or bulk PCAP, and CSV.
| Software | Version | Purpose |
|---|---|---|
| Docker | Latest | Container runtime |
| Docker Compose | Latest | Multi-container orchestration |
| LLM Server | Any OpenAI-compatible API, self- or LAN-hosted | AI features (e.g. LM Studio, Ollama) — optional |
Minimum hardware (sizes the TracePcap stack only; the LLM, if self-hosted, is extra):
| Minimum | Recommended | Comfortable | |
|---|---|---|---|
| RAM | 6GB (SURICATA_ENABLED=false) |
8GB+ | 16GB |
| CPU | 4 cores | 4+ cores | 8 cores |
| Storage | 10GB | 50GB+ | 100GB+ SSD |
The default stack's container limits total ~4.4GB (~5.4GB with the Keycloak auth overlay). Upload size is derived from APP_MEMORY_MB (max upload ≈ 16% of it; 327MB at the default 2048). See Container Resource Limits for the per-service breakdown and tuning.
1. Clone and set up:
git clone https://github.com/NotYuSheng/TracePcap.git
cd TracePcap
cp .env.example .env
2. Configure .env (defaults work out of the box; AI features need an LLM endpoint):
APP_MEMORY_MB=2048                          # 327MB max upload (derived from this)
NGINX_PORT=80                               # change if port 80 is in use
LLM_API_BASE_URL=http://localhost:1234/v1   # local/LAN inference server (must not be a public API)
LLM_MODEL=Qwen2.5-14B-Coder-Instruct
3. Start the application:
docker compose up -d4. Open http://localhost:80 in your browser.
Note: First startup may take a minute while PostgreSQL and MinIO initialise. AI features require a running LLM server pointed to by
LLM_API_BASE_URL; all other features work without it. TracePcap is built to run fully offline —LLM_API_BASE_URLmust point to a self- or LAN-hosted server, never a public/internet API.
- Upload — drag-and-drop a PCAP/PCAPNG/CAP file; optionally enable nDPI analysis and file extraction
- Analyze — processed asynchronously with a per-stage progress view
- Overview — detected applications, protocols, risk alerts, and custom signature matches
- Visualize — explore the interactive topology with filters, layout controls, and node detail panels
- Conversations — review flows with advanced filtering, session reconstruction, and payload inspection
- Story Mode — read the AI-generated narrative and ask follow-up questions
- Extracted Files — browse and download files recovered from HTTP responses and raw streams
- Generate Filters — create Wireshark/tcpdump filters from natural language
- Export — a PDF report, per-conversation or bulk PCAP, or CSV
Build a picture of an unknown network from captures taken at different times, and track how it changes between them:
- Create a Network (e.g. "Client Site — Building A")
- Add Snapshots — upload PCAPs in capture order; each becomes a time-ordered snapshot
- Review the Diagram — changed nodes are highlighted by severity
- Track Drift — device, IP, protocol, and VPN changes detected automatically between consecutive snapshots
- Define Subnets — "Detect Subnets" to infer CIDRs from traffic, or add them manually
- Annotate Nodes — assign role labels, with "Suggest with AI" from traffic signals
- Correlate Events — log real-world events (maintenance windows, incidents) against observed changes
- Generate Insights — an AI narrative explaining changes across snapshots
The Monitor assumes you know nothing about the network upfront: there is no persistent agent or sensor — you feed in PCAPs and it compares them. Subnets, device roles, and topology are all inferred from traffic rather than imported from a CMDB, and the first snapshot becomes the implicit baseline for change detection. See Network Monitor for the full change-detection event reference.
PCAP, PCAPNG, CAP (max 327MB at the default APP_MEMORY_MB).
| Component | Technology |
|---|---|
| Backend | Spring Boot 3.2.1, Java 21, Maven, Lombok, MapStruct |
| Frontend | React 19, Vite, TypeScript, SGDS React |
| Visualization | Sigma.js + graphology + ELK (topology), React Flow (cluster graph), Recharts, D3.js |
| Reverse Proxy | Nginx |
| Packet Parsing | tshark / Wireshark, nDPI v5 (deep packet inspection) |
| Database | PostgreSQL 15 with Flyway migrations |
| Object Storage | MinIO (S3-compatible) |
| Containerization | Docker, Docker Compose |
| API Documentation | SpringDoc OpenAPI (Swagger UI) |
Full documentation is at https://notyusheng.github.io/TracePcap. Start here for anything not covered in this README:
- Installation & prerequisites · Offline / air-gapped deployment
- Feature guides — one page per capability above
- Custom signature rules — full YAML spec, match fields, and payload/regex matching
- Authentication (OIDC / Keycloak) · Environment variables · LLM setup
- Operations — logs, backups, database access, production hardening
Interactive API docs (Swagger UI) are at http://localhost:80/swagger-ui.html when the app is running.
- Local processing — all PCAP analysis runs on your server; packet data never leaves your infrastructure
- Offline-capable — GeoIP uses a bundled DB-IP MMDB fallback; LLM queries use a configurable local endpoint
- No authentication by default — the base stack runs fully open; enable OIDC/Keycloak auth before exposing to multiple users (see the Authentication guide, and change all default credentials for any real deployment)
- Object storage — MinIO is not exposed outside the Docker network
Data is shared across all authenticated users (no per-user ownership) in this version; per-user scoping is tracked separately (issues #360, #444).
The sample-files/ directory contains example PCAPs, including atm_capture1.cap (ATM traffic), free5gc.pcap (5G core), demo_all_rules.pcap (triggers the full set of custom signature demo rules), dns_demo.pcap and http_demo.pcap (classification demos, each with a gen_*.py regenerator), and monitor_large/ (8 weekly snapshots of a simulated 550-node network for the Network Monitor). A full set of demo rules is in signatures.sample.yml.
Licensed under the MIT License. See LICENSE for details.