Repository navigation
Conversation


The JS hang tracker samples the JS thread for 300 ms but keeps only one stack for the event. Add flamegraphFromHermesTrace:newestFirst:bundleDebugId:, which turns all samples of the Hermes trace into an event.flamegraph payload (version 1, platform javascript), so the time spent during the hang becomes visible.

The builder keeps the JS frames of each sample, puts each Hermes frame into the frame table once, and builds one tree per thread with inclusive sample counts from caller to callee, without recursion. For a profile trace it uses only the samples within the sample window of the newest one. The tree of the thread that gives the event stack gets thread_attributed, and a known bundle Debug ID adds a sourcemap debug image. It returns nil for traces without JS samples, for invalid traces, and for payloads larger than 10 MiB.

The event stack and the flame graph now share one Hermes frame mapping and one stack walk, so their frames cannot differ. The report path does not call the builder yet. XCTest coverage is added to RNSentryCocoaTester.
The JS hang event carried only one stack, although the tracker samples the JS thread for the whole window. When the new attachFlamegraph flag is on, the tracker now builds a flame graph from the same Hermes trace and attaches it to the event as flamegraph.json with the event.flamegraph attachment type.

The tracker reads the flag before it leaves the tracker thread. The capture goes through a new SentrySDKWrapper method that adds the attachment in a scope block. When the flag is off, or when the builder returns nothing (no trace, no JS samples, or more than 10 MiB), the event is captured as before. The capture stays inside the existing @try/@catch, and the event fields do not change.

RNSentry exports setAttachJsHangFlamegraph as a separate method, so the released startJsHangTracking signature stays the same for older JS bundles.
The native JS hang tracker on iOS can attach a flame graph of the sampled JS stacks to its events. The new experimental attachJsHangFlamegraph option turns this on. It is off by default and works only together with enableJsHangTracking.

Sentry.init passes the option to jsHangTrackingIntegration. After init, the integration calls the new setAttachJsHangFlamegraph bridge method before startJsHangTracking. The flag is a separate method, so the released startJsHangTracking signature does not change. The wrapper skips the call when an older native binary does not have the method, so JS hang tracking still starts there. initNativeSdk does not send the option to the native SDK.

Android gets methods that do nothing for both architectures, because JS hang tracking is iOS only. The API report is regenerated.
Add a CHANGELOG entry for the experimental, iOS-only attachJsHangFlamegraph option. The entry says that the frames in the flame graph are not yet symbolicated with source maps. The PR link is a placeholder until the PR is open.

The React Native sample already enables enableJsHangTracking. It now also enables attachJsHangFlamegraph, so the manual check of JS hang events includes the flame graph attachment.
Replace the PR link placeholder in the attachJsHangFlamegraph entry with #7042.

Semver Impact of This PR⚪ None (no version bump detected) 📋 Changelog PreviewThis is how your changes will appear in the changelog.
🤖 This preview updates automatically when you update the PR. |
|


📲 Install BuildsAndroid
|

| NSMutableDictionary<NSNumber *, NSNumber *> *siblingIndexesByFrame | ||
| = rootIndexesByThread[threadId]; | ||
| for (NSString *frameId in frameIds) { | ||
| NSNumber *frameIndex = frameIndexes[frameId]; |
There was a problem hiding this comment.
m: Frames are deduplicated by Hermes ID, but Hermes gives each call-tree position its own ID, so the same function reached from different callers gets duplicate frames and unmerged sibling nodes. The spec says producers SHOULD deduplicate by frame content. Could we key frameIndexes on a function|lineno|colno string instead? Not on the NSDictionary itself: its hash is its count, so lookups become a linear scan.
|
|
||
| NSData *data = [NSJSONSerialization dataWithJSONObject:flamegraph options:0 error:nil]; | ||
| return data.length <= kMaxFlamegraphBytes ? data : nil; | ||
| } @catch (NSException *exception) { |
There was a problem hiding this comment.
m: This @catch returns nil without logging, unlike the capture path at line 228. Could we add an NSLog here, and at the size check on line 374 too?
| throw new Error('native error'); | ||
| }); | ||
|
|
||
| expect(() => NATIVE.setAttachJsHangFlamegraph(true)).not.toThrow(); |
There was a problem hiding this comment.
m: Could we also assert that debug.error is called, not just not.toThrow()?
| bundleDebugId:(nullable NSString *)bundleDebugId | ||
| { | ||
| @try { | ||
| NSDictionary *profile = [NSJSONSerialization JSONObjectWithData:trace options:0 error:nil]; |
There was a problem hiding this comment.
l: The trace is parsed a second time here (first at line 238). We could parse it once and pass the result to both builders.
|
|
||
| RCT_EXPORT_METHOD(stopJsHangTracking) { [[RNSentryJSHangTracker sharedInstance] stop]; } | ||
|
|
||
| RCT_EXPORT_METHOD(setAttachJsHangFlamegraph : (BOOL)enabled) |
There was a problem hiding this comment.
l: No @try/@catch at the bridge boundary. Optional, since setting an atomic BOOL can't realistically throw.
| /** | ||
| * When enabled, the SDK attaches a flame graph of the sampled JavaScript stacks to the events | ||
| * of `enableJsHangTracking`. The flame graph shows where the JavaScript thread spent its time | ||
| * during the hang. It requires `enableJsHangTracking` and Hermes. |
There was a problem hiding this comment.
l: "during the hang" overstates it; the graph covers a ~300 ms window when the hang was detected. Same wording in CHANGELOG.md:14.
| import { getDefaultIntegrations } from '../../src/js/integrations/default'; | ||
| import { jsHangTrackingIntegration } from '../../src/js/integrations/jsHangTracking'; | ||
|
|
||
| jest.mock('../../src/js/integrations/jsHangTracking', () => { |
There was a problem hiding this comment.
l: Could we assert the observable effect, NATIVE.setAttachJsHangFlamegraph(true), instead of using jest.mock on the integration?
 antonis
left a comment
antonis
left a comment
There was a problem hiding this comment.
Overall LGTM 🎉
Tested locally on an iOS Release build and got a flamegraph :)
Sentry link: https://sentry-sdks.sentry.io/issues/SENTRY-REACT-NATIVE-WDT/events/0992dabdb1054187bcb30475a757ddae/

Left a few comments but nothing blocking.
Let's also merge the latest from main and move the changelog to unreleased.


Good point @philprime 👍 I guess not but I think @alwx is already iterating on this. |


|
@philprime yep that's fixed already |
|
Ah yes I found it now 👍 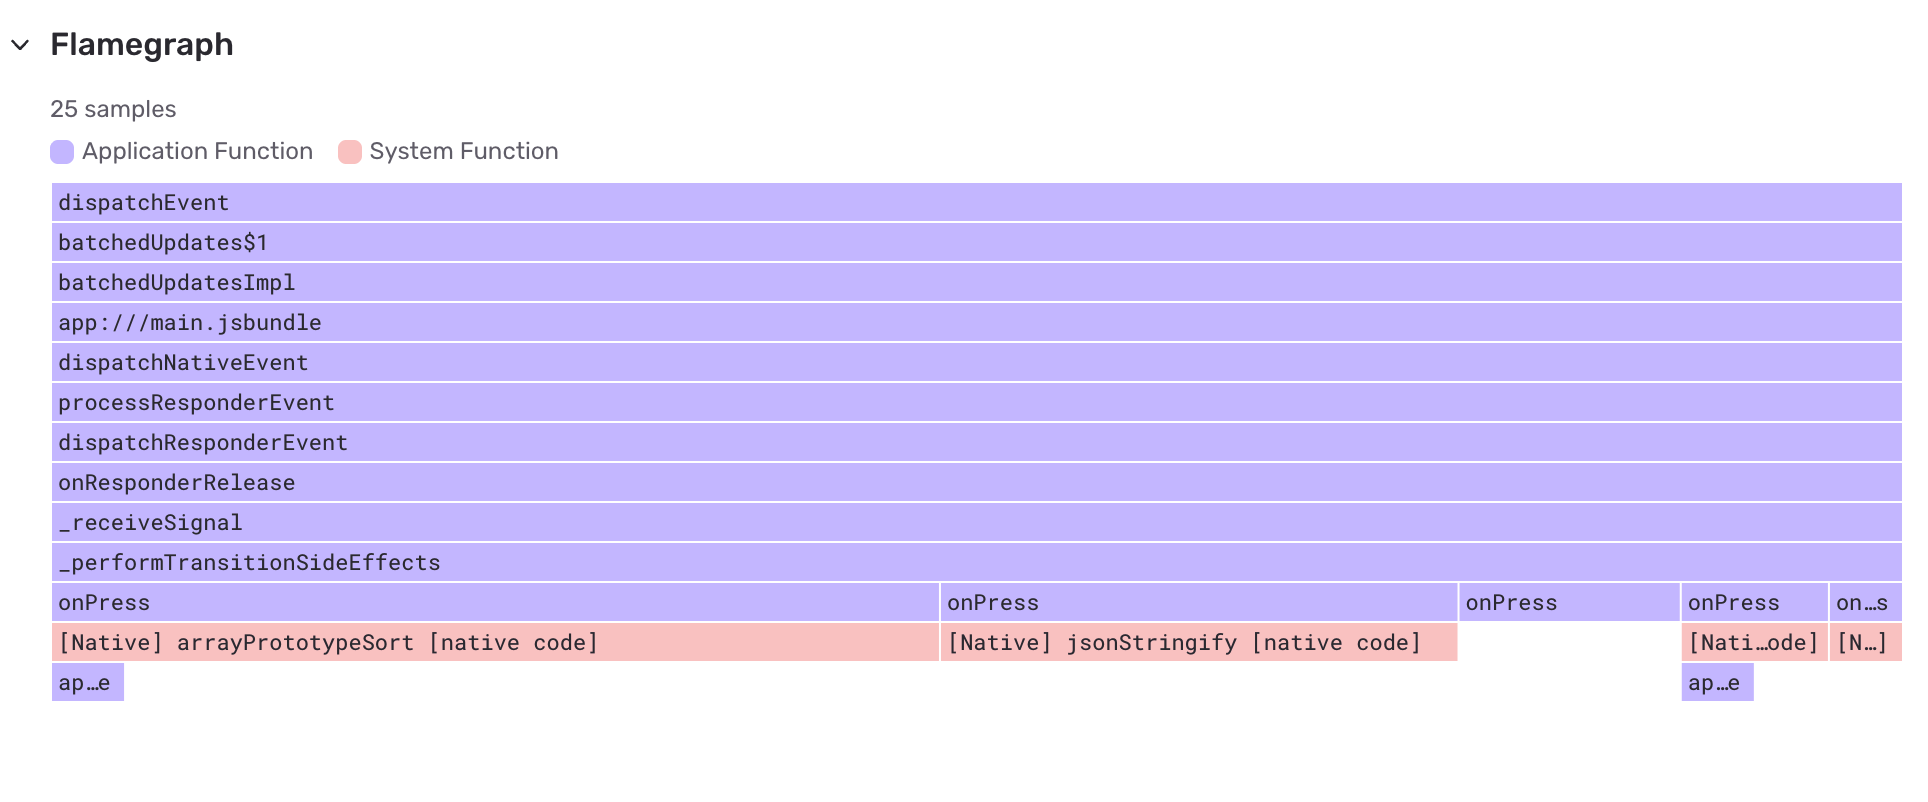
|


📢 Type of change
📜 Description
Adds the experimental, iOS-only option
attachJsHangFlamegraph. WhenenableJsHangTrackingreports a JS hang, the native tracker now builds a flame graph from all Hermes samples of its existing 300 ms window and attaches it asflamegraph.jsonwith theevent.flamegraphattachment type. The event stack, grouping, and other event fields do not change.The flag reaches native through the new
setAttachJsHangFlamegraphbridge method, so the releasedstartJsHangTrackingsignature stays the same and older native binaries still start JS hang tracking. Android gets no-op methods.💡 Motivation and Context
The JS hang event kept one stack and discarded all other samples of the window. A flame graph shows where the JS thread spent its time during the hang. It uses the same attachment format as the sentry-cocoa MetricKit hang flame graphs, and Relay already accepts it with
platform: "javascript".💚 How did you test it?
RNSentryCocoaTestersuite passes (218 tests, 0 failures).yarn test,yarn lint,yarn circularDepCheck, andapi-report:checkpass.📝 Checklist
sendDefaultPIIis enabled.🔮 Next steps